Dashboard Management
The Incipulse Dashboard is your command center for monitoring system health and service reliability. This guide covers how to create, customize, and manage your dashboards and charts.
1. Creating and Copying Dashboards
Incipulse allows you to create multiple Dynamic Dashboards tailored for different teams or environments.
Predefined Dashboards
By default, the system provides 4 Predefined Dashboards:
- These are non-editable and cannot be deleted.
- They serve as standard templates for system-wide health and analytics.
Creating a New Dashboard
- Navigate to Dashboard in the admin sidebar.
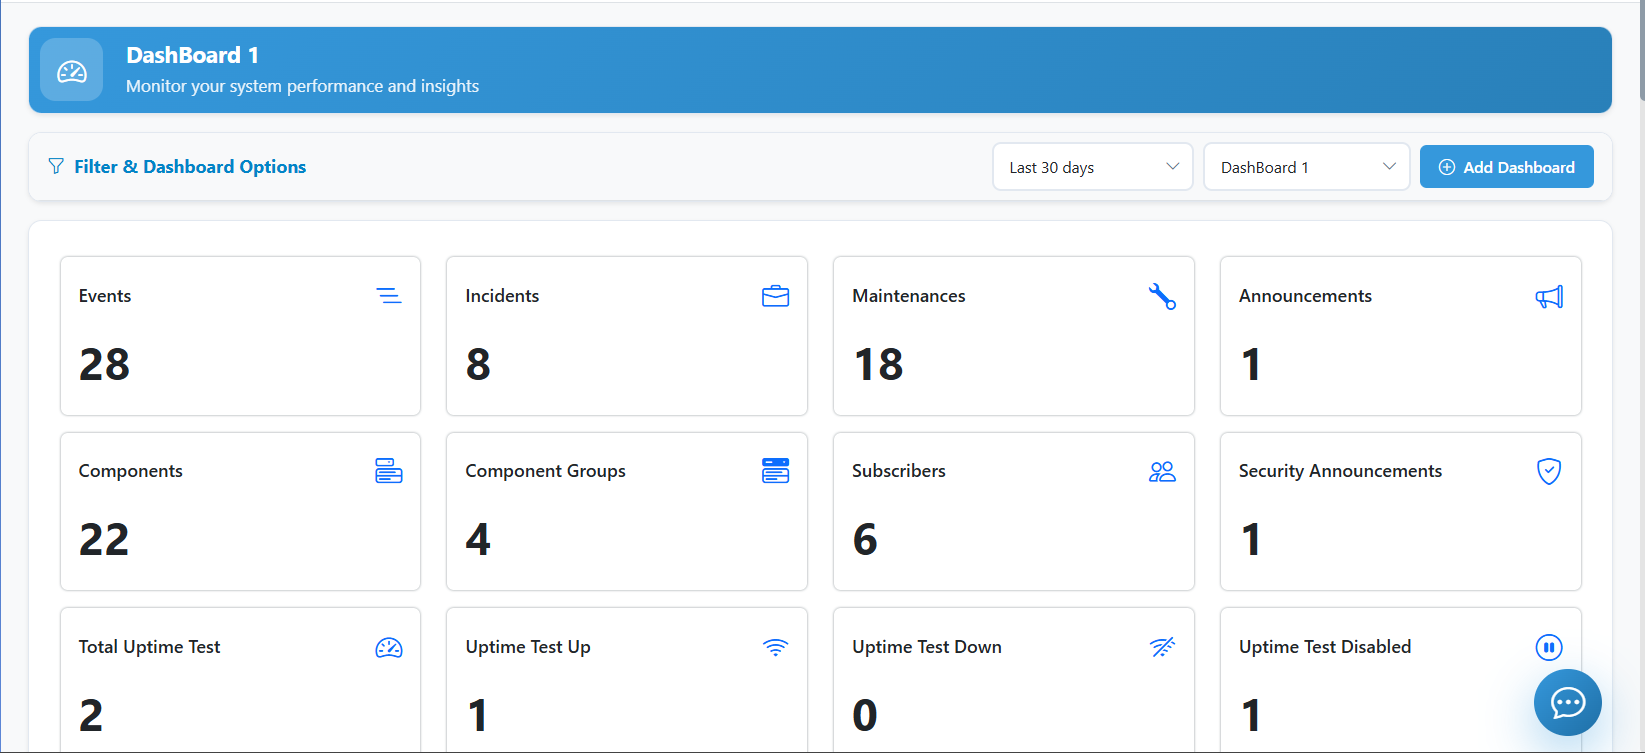
- Click the Add Dashboard button (top right).
- Provide a Title (e.g., "SRE Overview").
- Click Save.
Copy Dashboard Feature
If you want to create a new dashboard based on an existing one:
- Open the dashboard you wish to duplicate.
- Click the Copy Dashboard (clone) icon.
- This will create a fresh instance with all identical charts and layouts, which you can then customize.
2. Managing Metrics & Charts
Each dashboard is composed of various widgets and charts that visualize your system's performance metrics.
Supported Metrics
- Uptime Percentage: Real-time availability score for your components.
- Average Response Time: Global or component-specific latency metrics.
- Incident Counts: Summary of active and historical incidents.
- Subscriber Trends: Growth and engagement data for your audience.
Adding a Chart
- Within a dashboard, click Add Dynamic Chart.
- Select your Chart Type:
- Pie Chart: Best for visualizing distribution (e.g., Incident categories).
- Bar Chart: Ideal for comparing component performance.
- Line Chart: Perfect for tracking response time trends over time.
- Configure the Data Source:
- Select specific Components to monitor.
- Choose a Time Range (Last 24 hours, 7 days, 30 days).
- Click Submit to pin the chart to your dashboard.
3. Customizing the Layout
Incipulse features a Drag-and-Drop interface for arranging your dashboard to suit your needs.
- Rearrange: Click and hold the header of any widget to drag it to a new position.
- Resize: Most widgets can be resized to highlight critical information.
- Delete: Click the "X" on a widget to remove it from the layout.
- Save Layout: Once you're happy with the arrangement, click Save Layout to persist the changes for all users on this dashboard.
4. Deleting a Dashboard
If you need to manage incidents, see the Incident Management guide.
If a custom dashboard is no longer needed:
- Select the dashboard from the switcher.
- Click Manage Dashboards.
- Select Delete next to the target dashboard.
- Confirm deletion. Warning: This will remove all charts and layout configurations associated with that dashboard.